An alias provided for backward compatibility with mizer version <= 1.0
plotM2(object, species = NULL, time_range, highlight = NULL, ...)
Arguments
| object | An object of class MizerSim or MizerParams. |
|---|---|
| species | Name or vector of names of the species to be plotted. By default all species are plotted. |
| time_range | The time range (either a vector of values, a vector of min and max time, or a single value) to average the abundances over. Default is the final time step. Ignored when called with a MizerParams object. |
| highlight | Name or vector of names of the species to be highlighted. |
| ... | Other arguments (currently unused) |
Value
A ggplot2 object
See also
plotting_functions, getPredMort
Other plotting functions:
animateSpectra(),
displayFrames(),
plot,MizerSim,missing-method,
plotBiomass(),
plotDiet(),
plotFMort(),
plotFeedingLevel(),
plotGrowthCurves(),
plotSpectra(),
plotYieldGear(),
plotYield(),
plotlyBiomass(),
plotlyFMort(),
plotlyFeedingLevel(),
plotlyGrowthCurves(),
plotlyPredMort(),
plotlySpectra(),
plotlyYieldGear(),
plotlyYield(),
plotting_functions
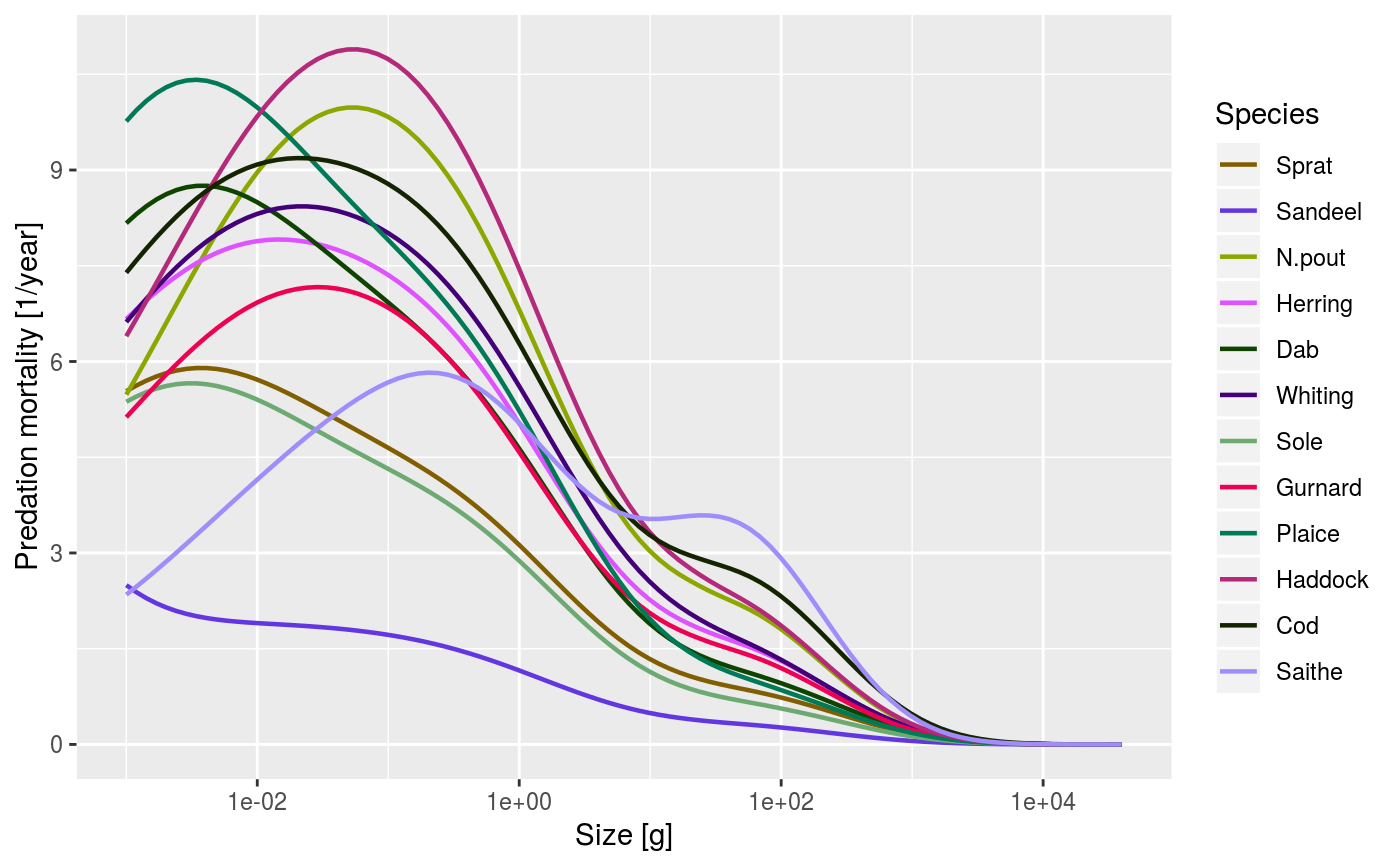
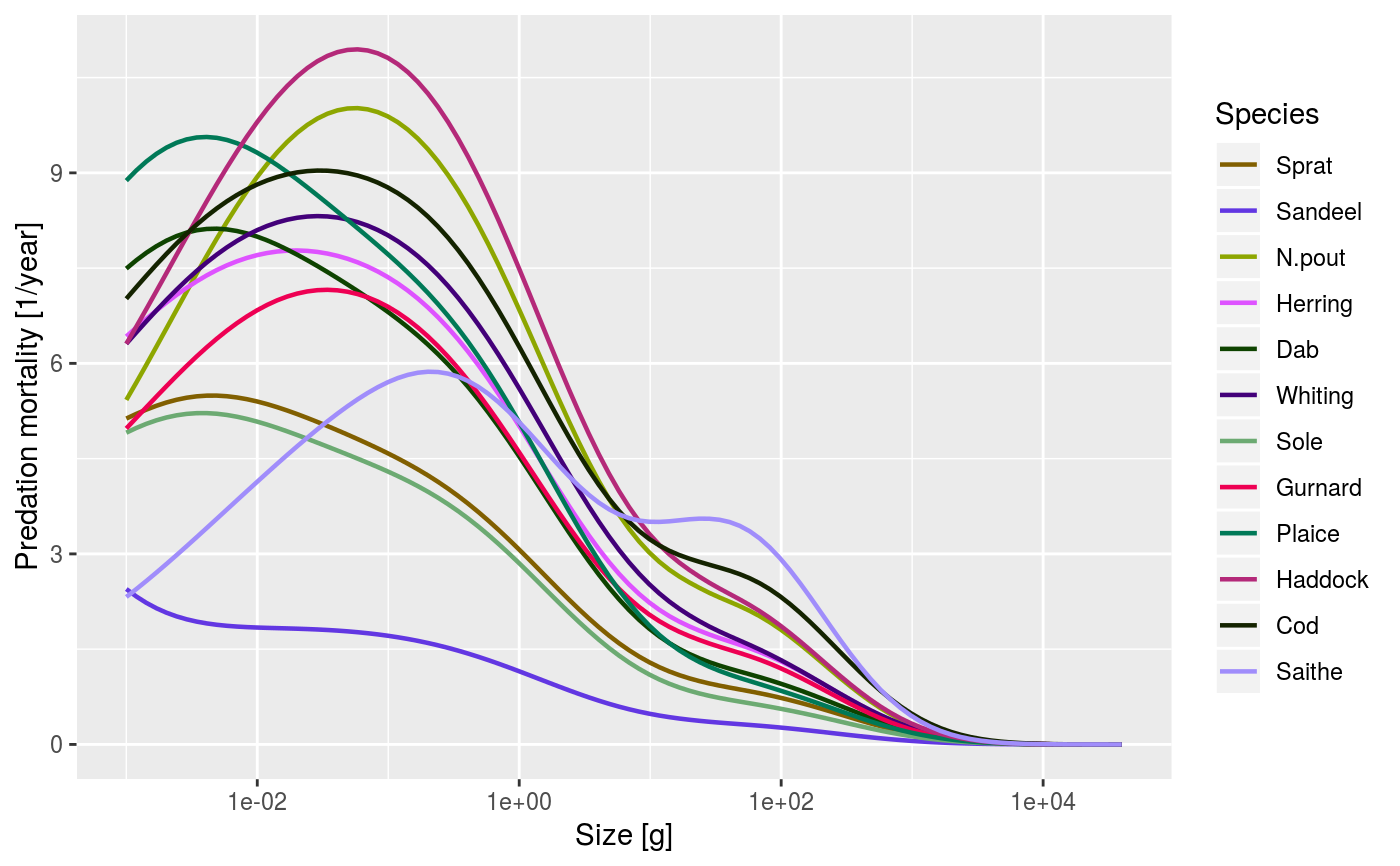
Examples
data(NS_species_params_gears) data(inter) params <- suppressMessages(newMultispeciesParams(NS_species_params_gears, inter)) sim <- project(params, effort=1, t_max=20, t_save = 2, progress_bar = FALSE) plotPredMort(sim)