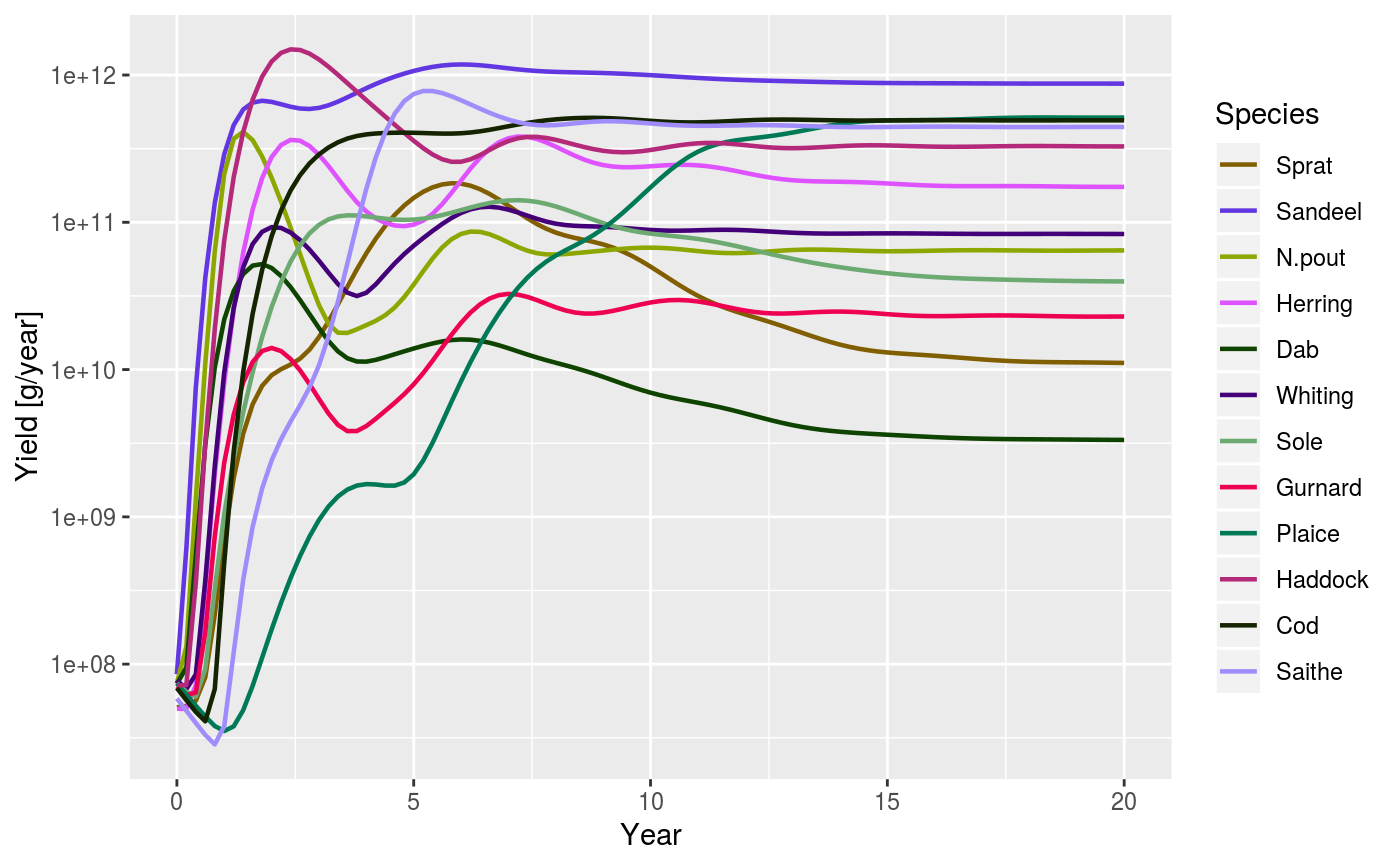
After running a projection, the total yield of each species across all
fishing gears can be plotted against time. The yield is obtained with
getYield.
plotYield(
  sim,
  sim2,
  species = dimnames(sim@n)$sp,
  total = FALSE,
  log = TRUE,
  highlight = NULL,
  ...
)
Arguments
| sim | An object of class MizerSim |
|---|---|
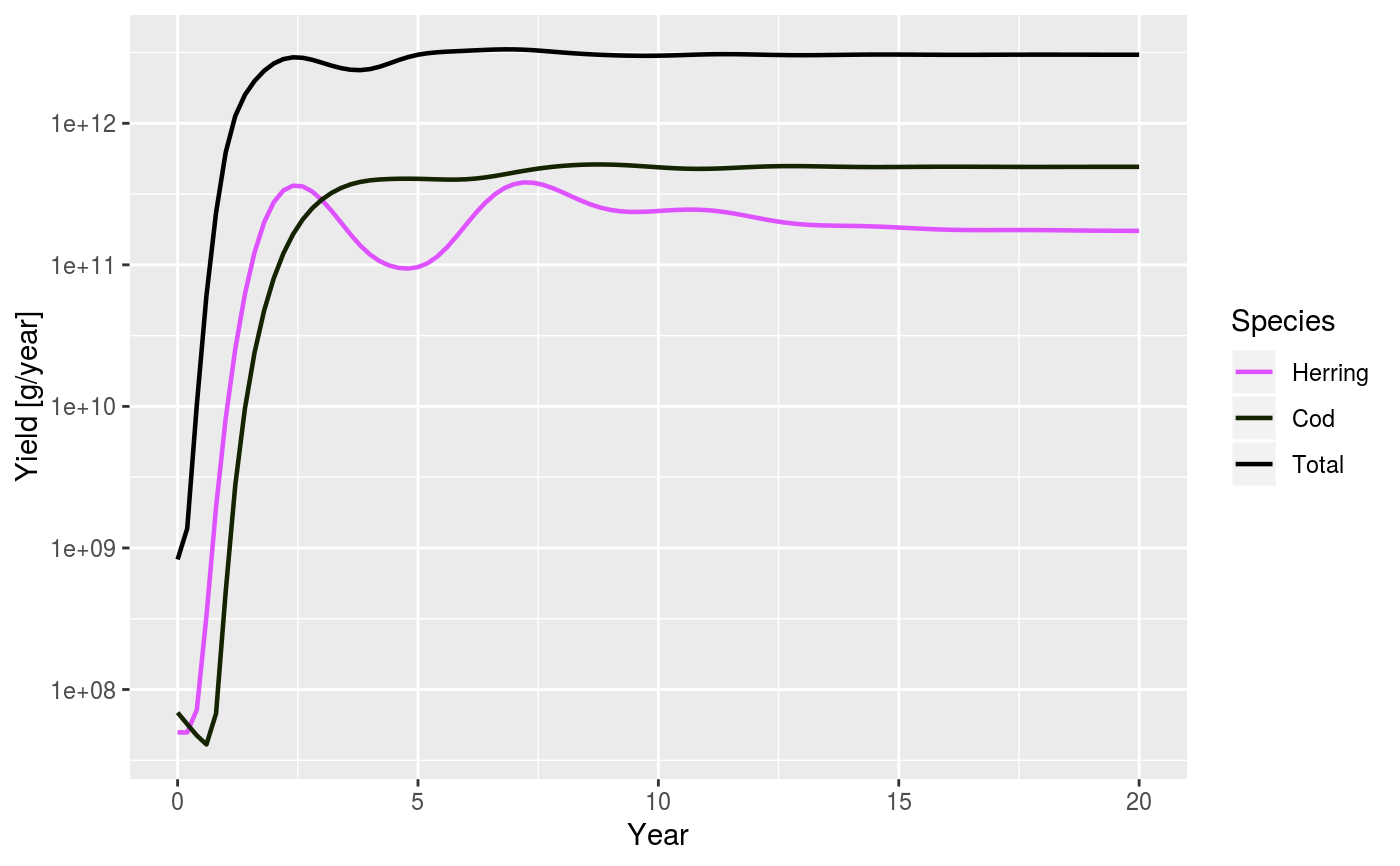
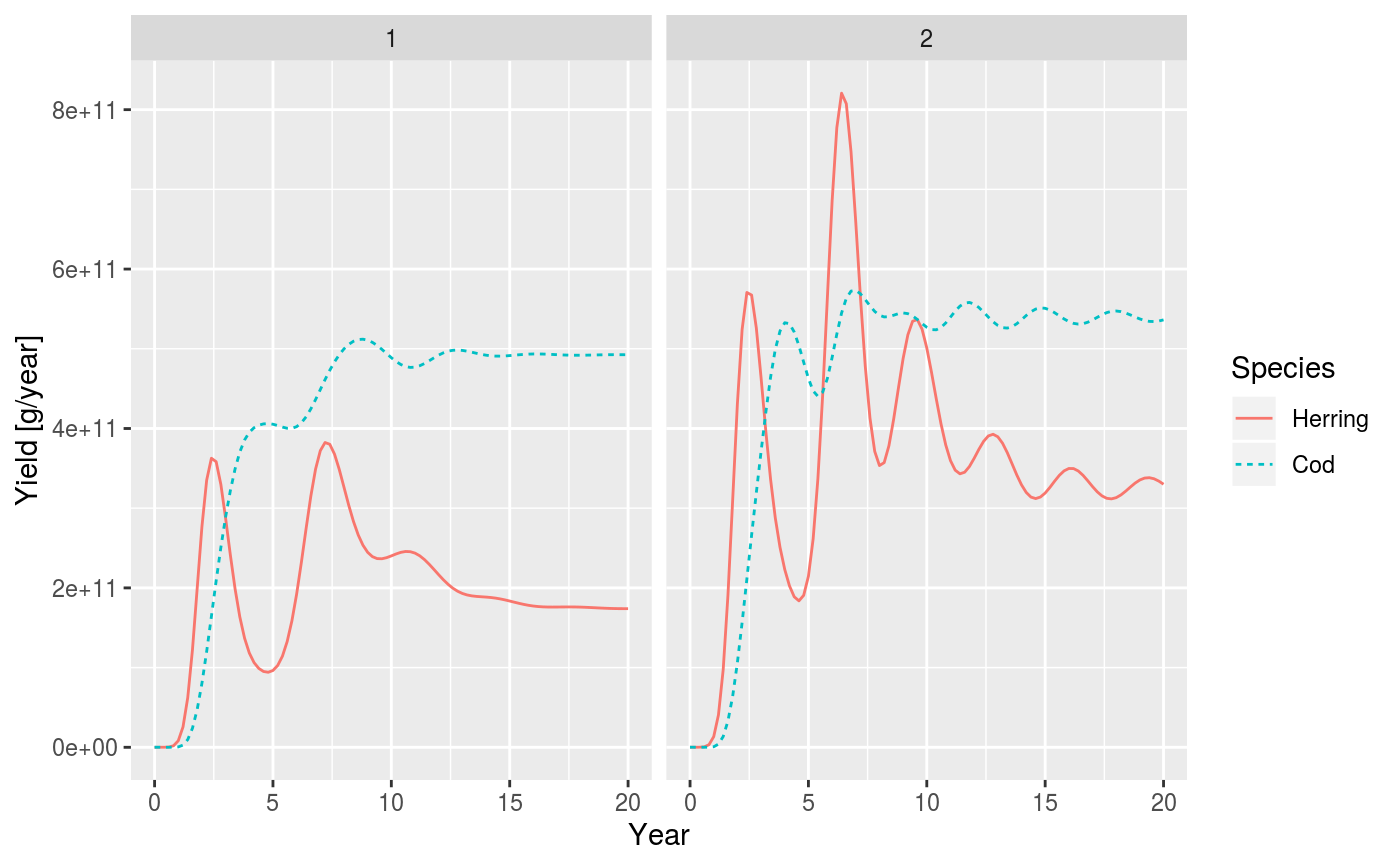
| sim2 | An optional second object of class MizerSim. If this is provided its yields will be shown on the same plot in bolder lines. |
| species | Name or vector of names of the species to be plotted. By default all species are plotted. |
| total | A boolean value that determines whether the total over all species in the system is plotted as well. Default is FALSE |
| log | Boolean whether yield should be plotted on a logarithmic axis. Defaults to true. |
| highlight | Name or vector of names of the species to be highlighted. |
| ... | Other arguments (currently unused) |
Value
A ggplot2 object
See also
Other plotting functions:
animateSpectra(),
displayFrames(),
plot,MizerSim,missing-method,
plotBiomass(),
plotDiet(),
plotFMort(),
plotFeedingLevel(),
plotGrowthCurves(),
plotPredMort(),
plotSpectra(),
plotYieldGear(),
plotlyBiomass(),
plotlyFMort(),
plotlyFeedingLevel(),
plotlyGrowthCurves(),
plotlyPredMort(),
plotlySpectra(),
plotlyYieldGear(),
plotlyYield(),
plotting_functions
Examples
data(NS_species_params_gears) data(inter) params <- suppressMessages(newMultispeciesParams(NS_species_params_gears, inter)) sim <- project(params, effort=1, t_max=20, t_save = 0.2, progress_bar = FALSE) plotYield(sim)# Comparing with yield from twice the effort sim2 <- project(params, effort=2, t_max=20, t_save = 0.2, progress_bar = FALSE) plotYield(sim, sim2, species = c("Cod", "Herring"), log = FALSE)