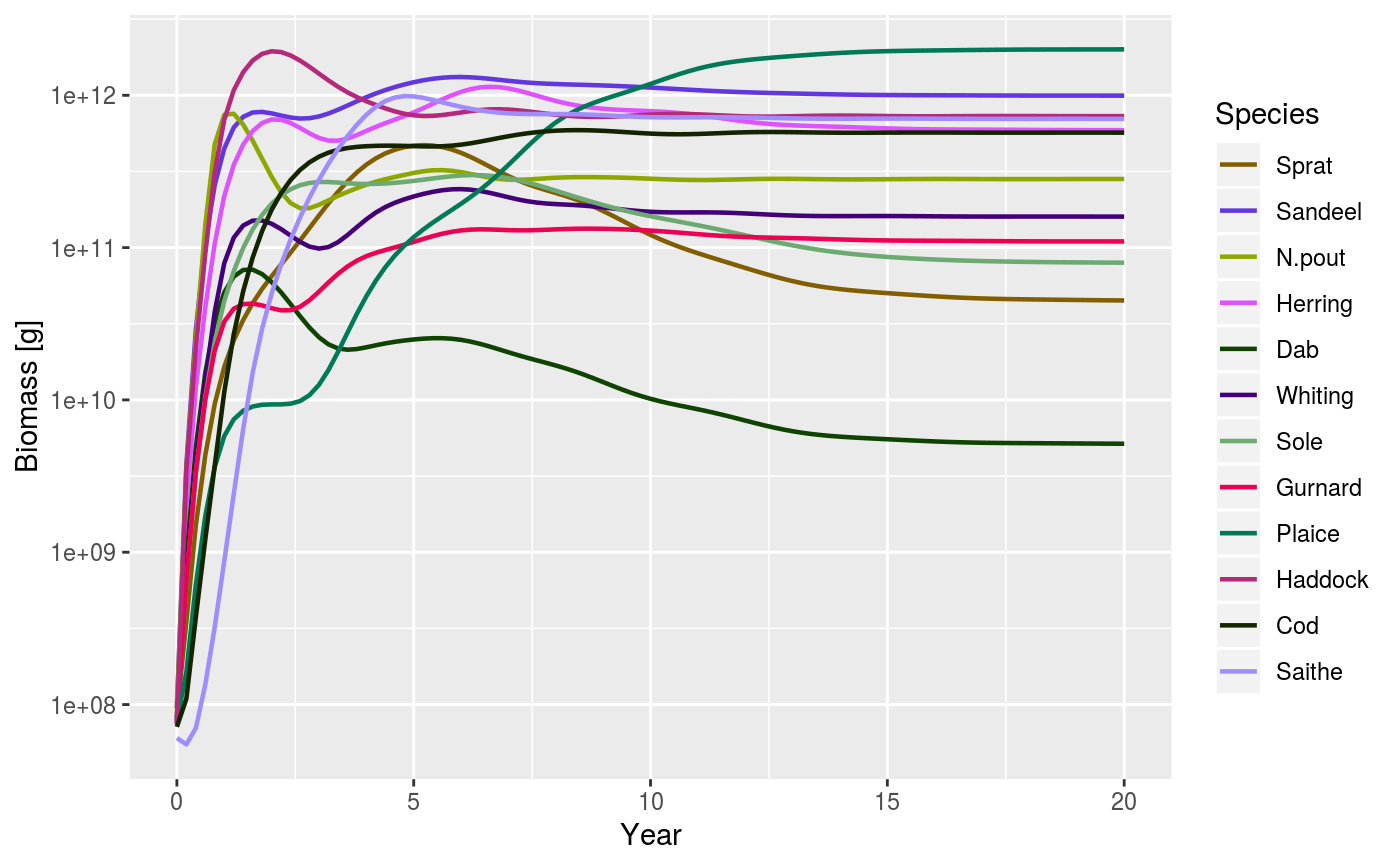
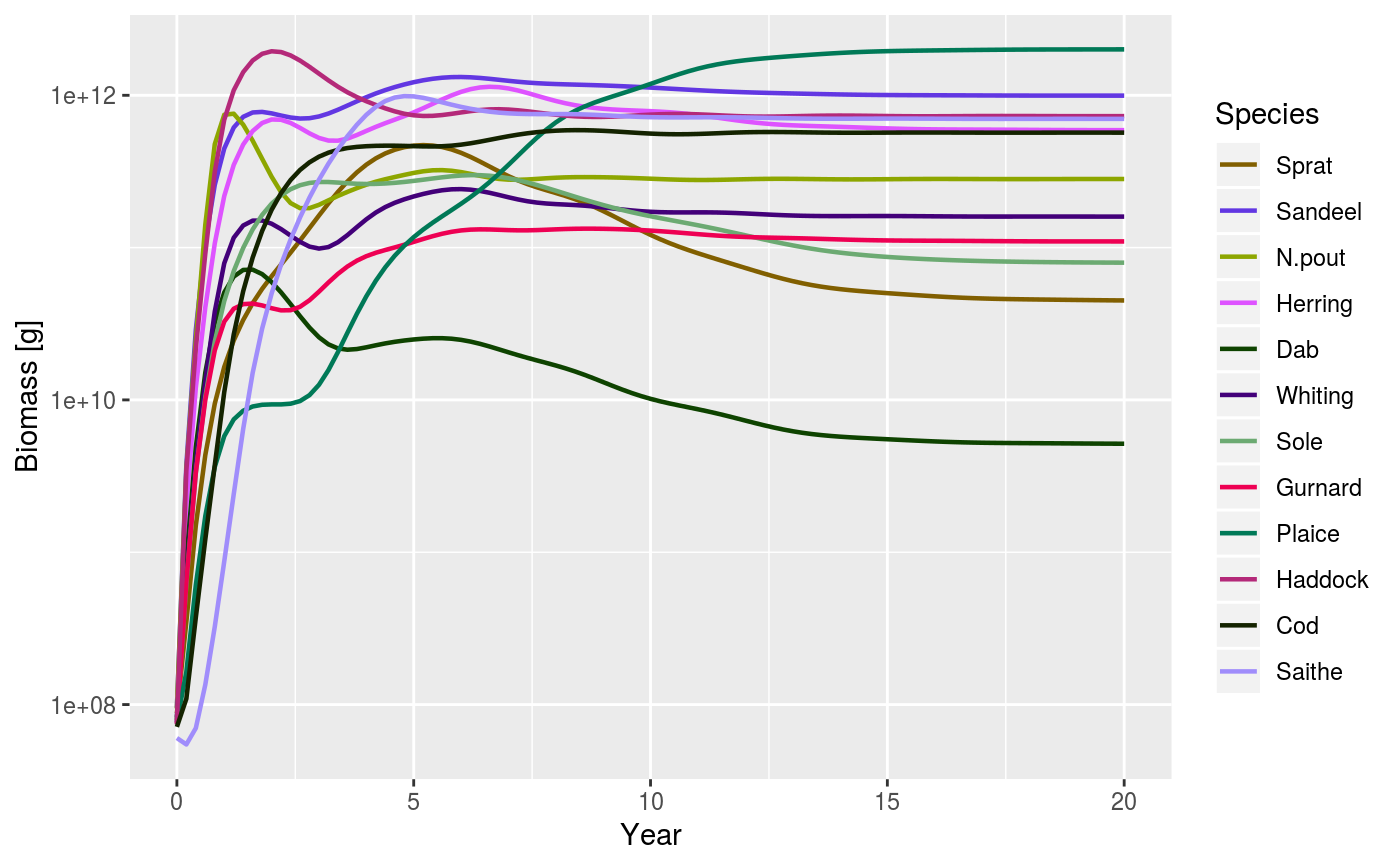
After running a projection, the biomass of each species can be plotted
against time. The biomass is calculated within user defined size limits
(min_w, max_w, min_l, max_l, see getBiomass).
plotBiomass(
  sim,
  species = dimnames(sim@n)$sp[!is.na(sim@params@A)],
  start_time = as.numeric(dimnames(sim@n)[[1]][1]),
  end_time = as.numeric(dimnames(sim@n)[[1]][dim(sim@n)[1]]),
  y_ticks = 6,
  ylim = c(NA, NA),
  total = FALSE,
  background = TRUE,
  highlight = NULL,
  ...
)
Arguments
| sim | An object of class MizerSim |
|---|---|
| species | Name or vector of names of the species to be plotted. By default all species are plotted. |
| start_time | The first time to be plotted. Default is the beginning of the time series. |
| end_time | The last time to be plotted. Default is the end of the time series. |
| y_ticks | The approximate number of ticks desired on the y axis |
| ylim | A numeric vector of length two providing lower and upper limits for the y axis. Use NA to refer to the existing minimum or maximum. Any values below 1e-20 are always cut off. |
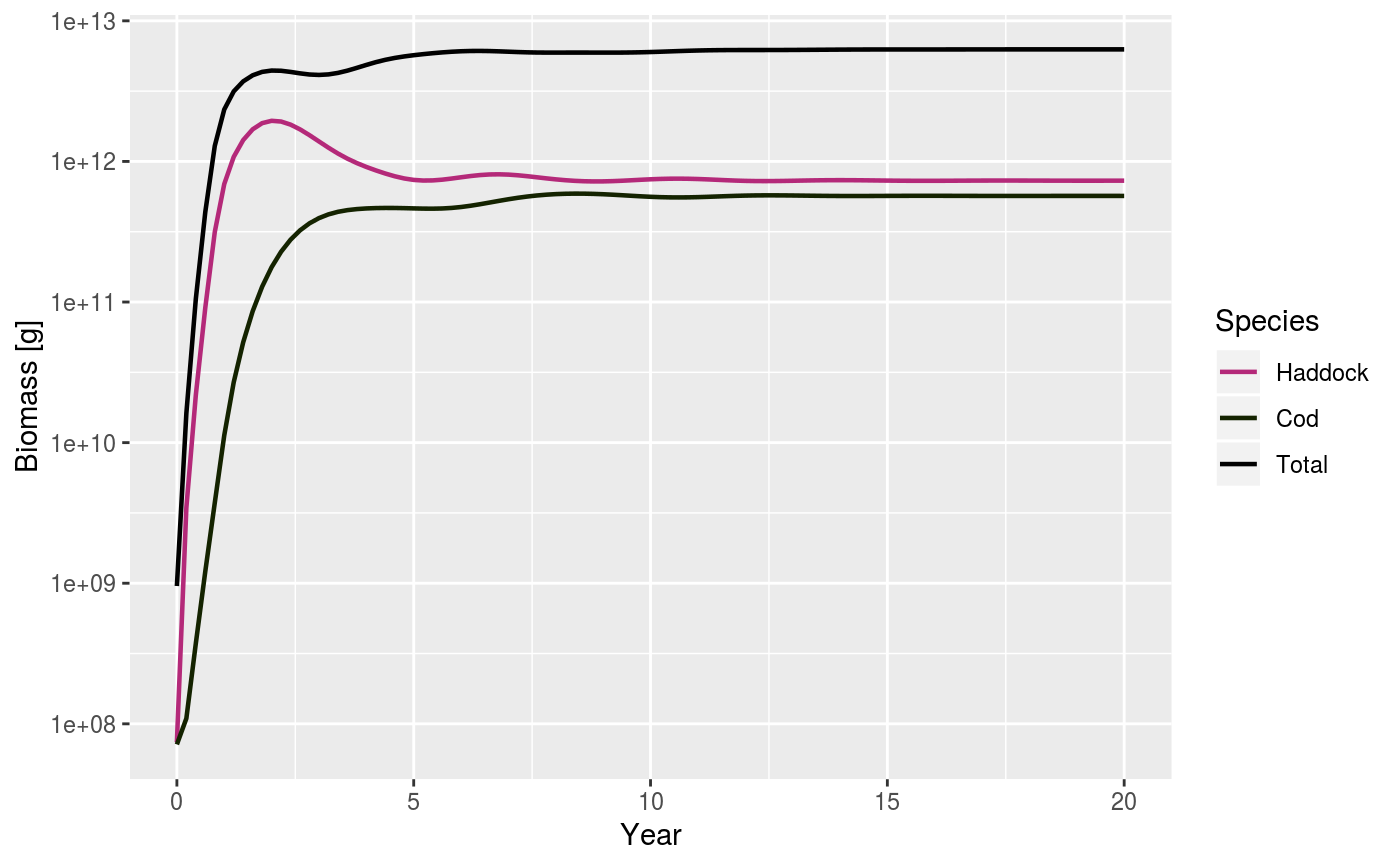
| total | A boolean value that determines whether the total biomass from all species is plotted as well. Default is FALSE. |
| background | A boolean value that determines whether background species are included. Ignored if the model does not contain background species. Default is TRUE. |
| highlight | Name or vector of names of the species to be highlighted. |
| ... | Arguments passed on to
|
Value
A ggplot2 object
See also
plotting_functions, getBiomass
Other plotting functions:
animateSpectra(),
displayFrames(),
plot,MizerSim,missing-method,
plotDiet(),
plotFMort(),
plotFeedingLevel(),
plotGrowthCurves(),
plotPredMort(),
plotSpectra(),
plotYieldGear(),
plotYield(),
plotlyBiomass(),
plotlyFMort(),
plotlyFeedingLevel(),
plotlyGrowthCurves(),
plotlyPredMort(),
plotlySpectra(),
plotlyYieldGear(),
plotlyYield(),
plotting_functions
Examples
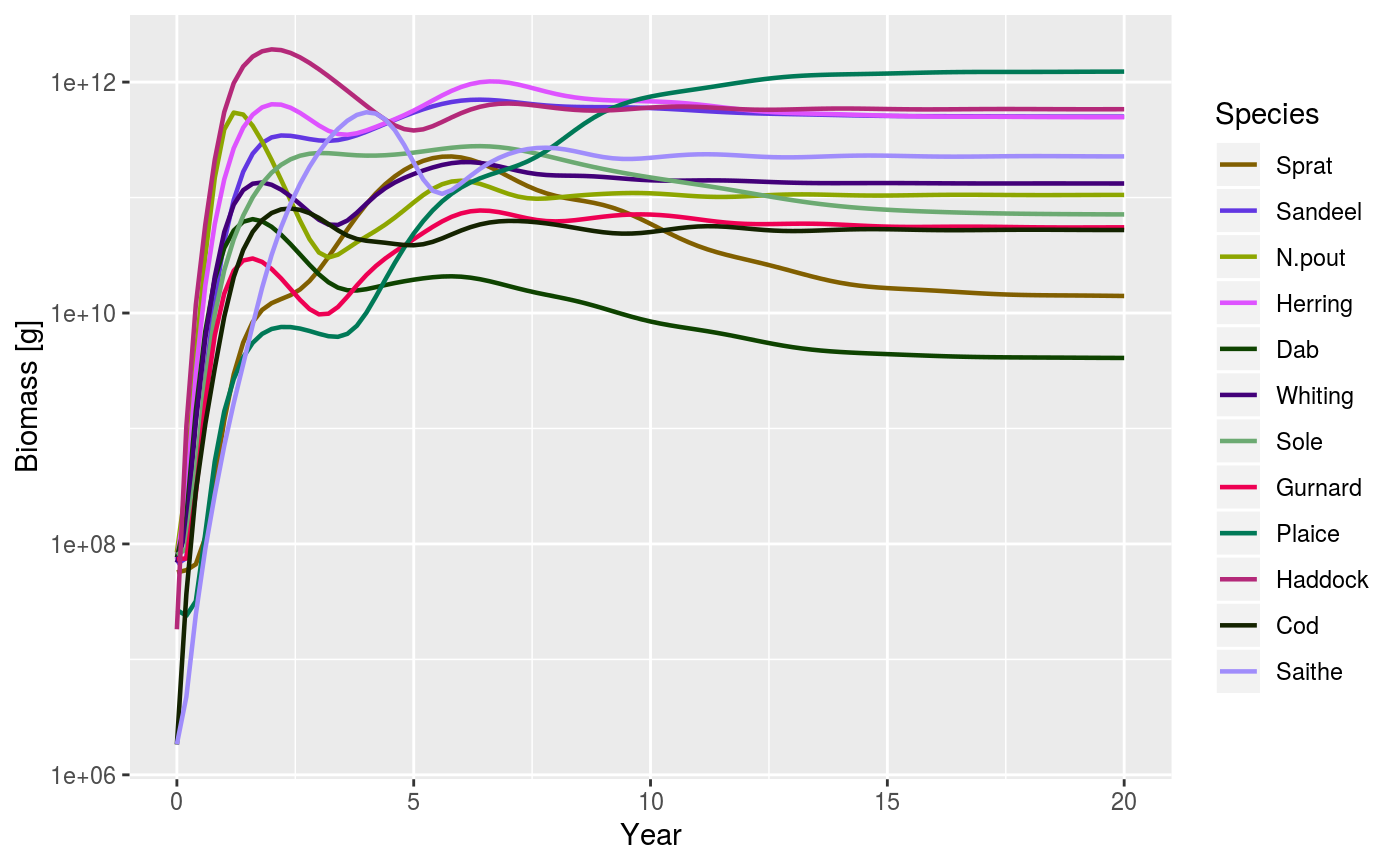
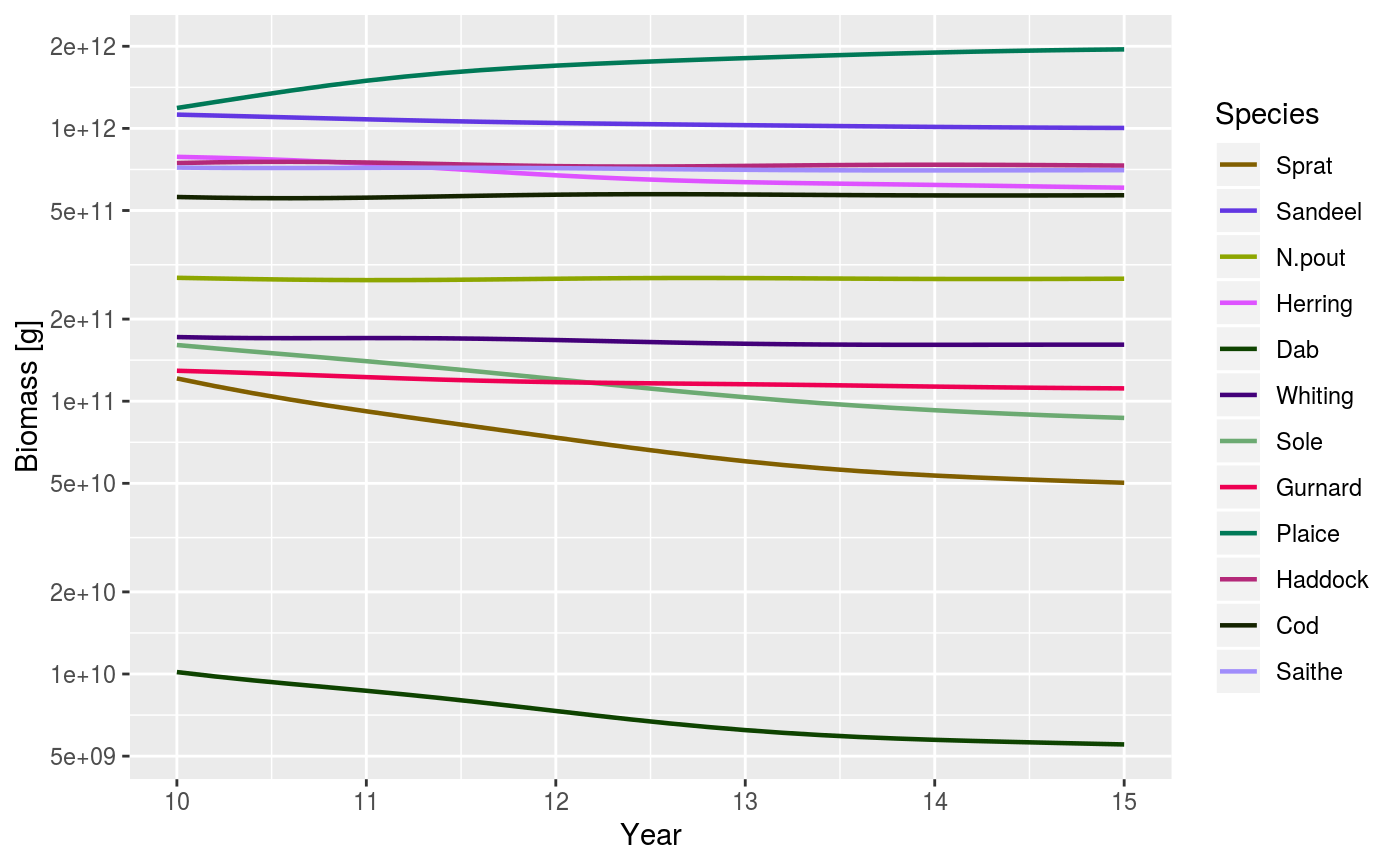
# Set up example MizerParams and MizerSim objects data(NS_species_params_gears) data(inter) params <- suppressMessages(newMultispeciesParams(NS_species_params_gears, inter)) sim <- project(params, effort = 1, t_max = 20, t_save = 0.2, progress_bar = FALSE) plotBiomass(sim)plotBiomass(sim, min_w = 10, max_w = 1000)plotBiomass(sim, start_time = 10, end_time = 15)plotBiomass(sim, y_ticks = 3)