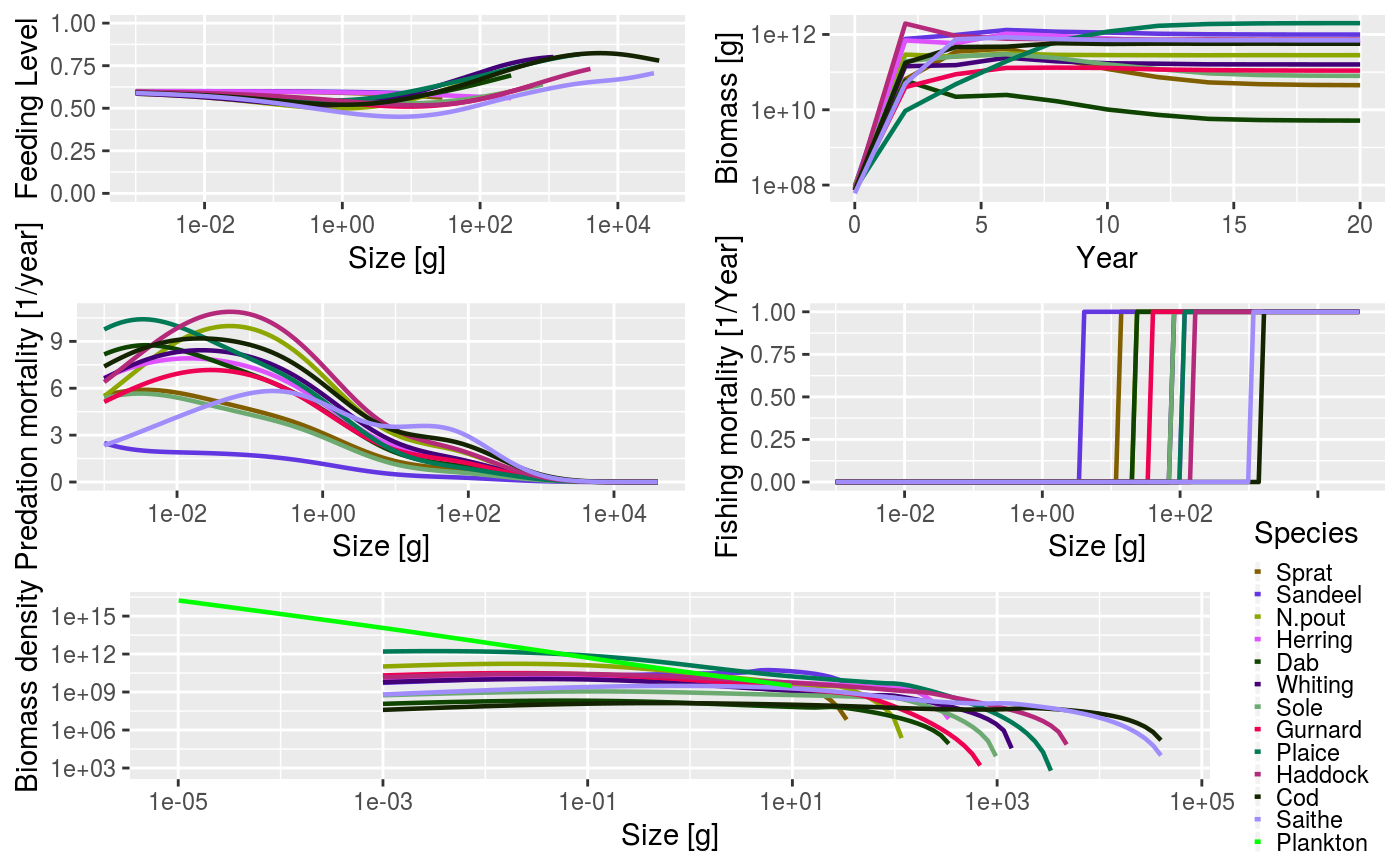
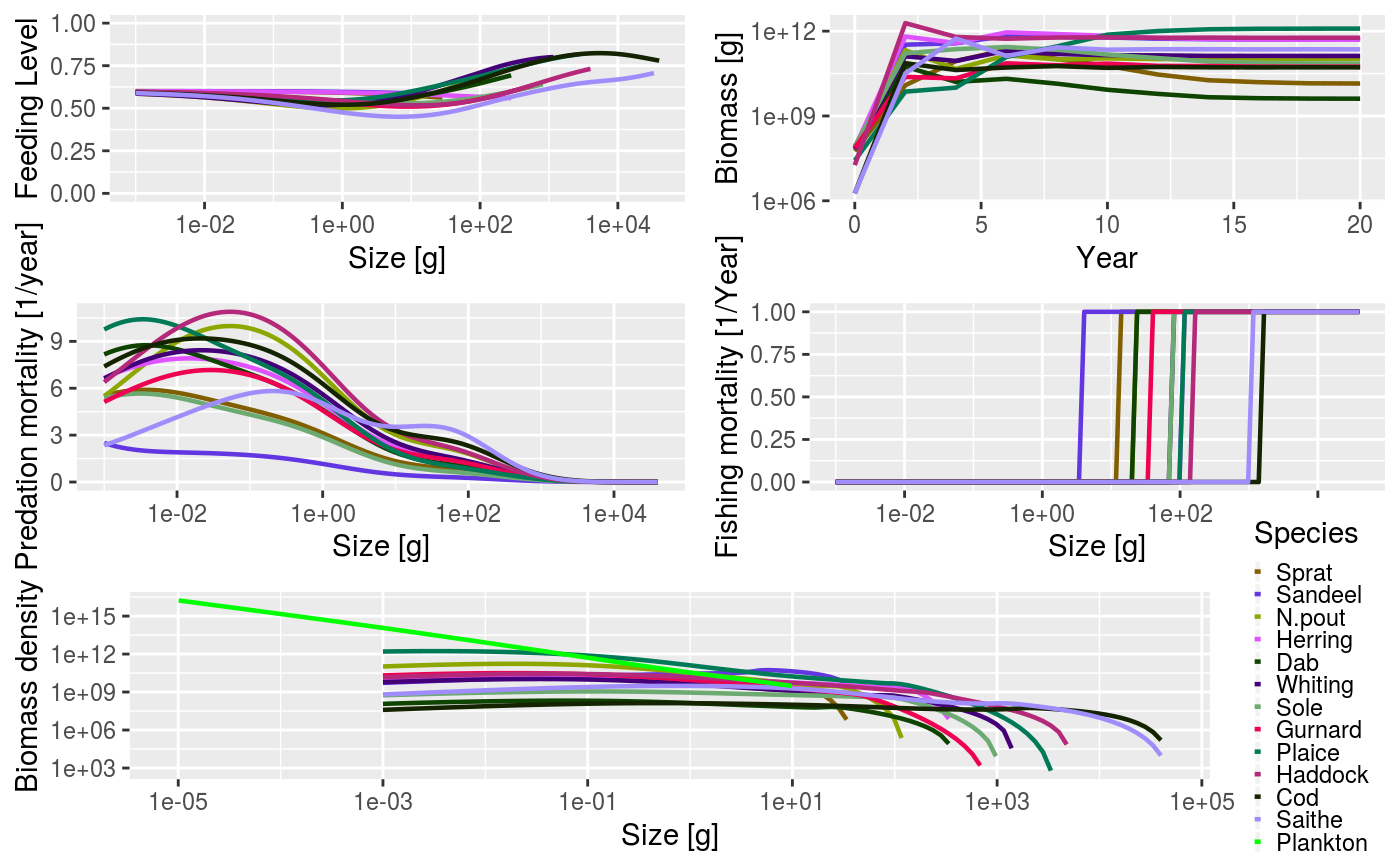
After running a projection, produces 5 plots in the same window: feeding level, abundance spectra, predation mortality and fishing mortality of each species by size; and biomass of each species through time. This method just uses the other plotting functions and puts them all in one window.
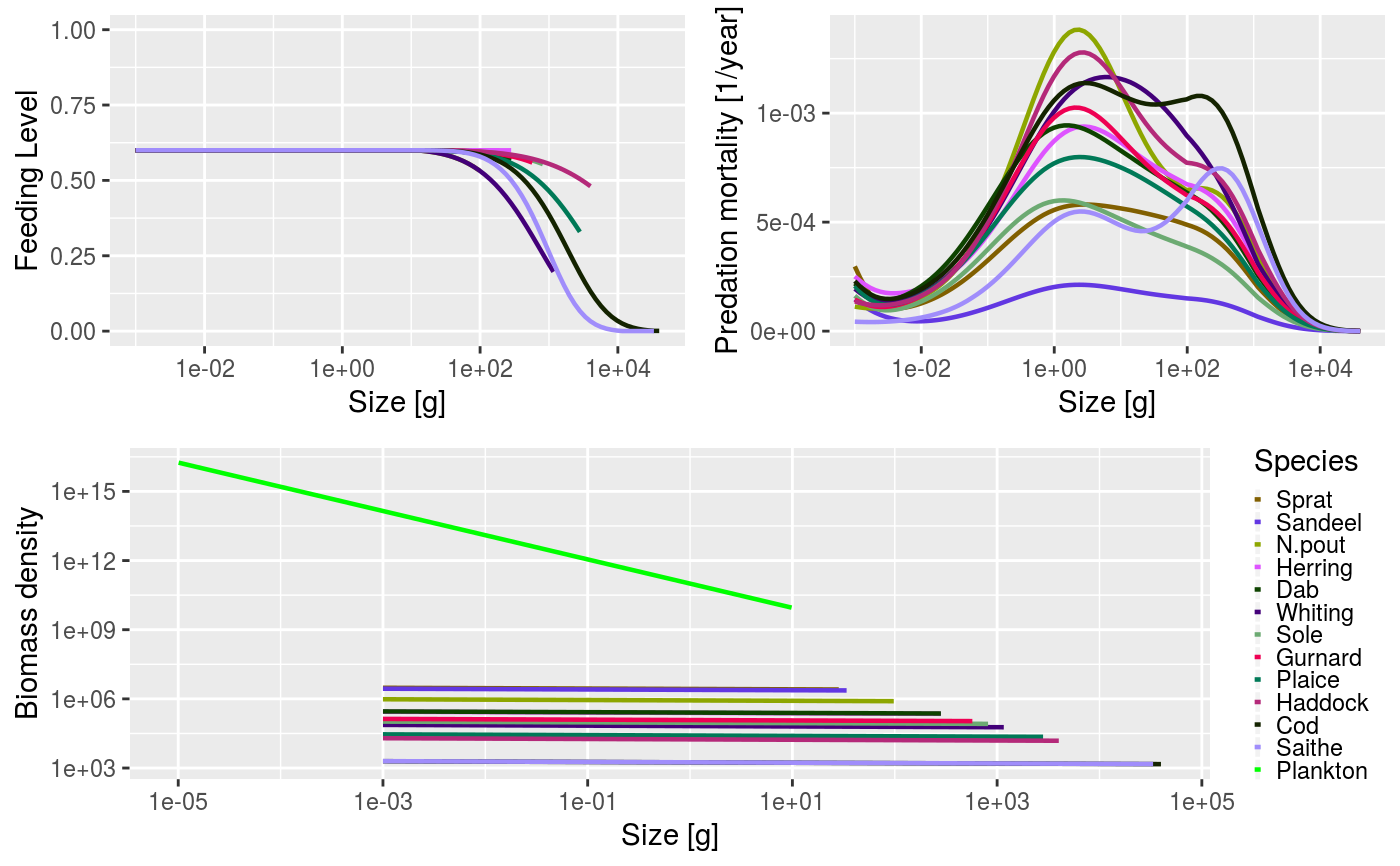
Produces 3 plots in the same window: abundance spectra, feeding level and predation mortality of each species through time. This method just uses the other plotting functions and puts them all in one window.
# S4 method for MizerSim,missing
plot(x, y, ...)

# S4 method for MizerParams,missing
plot(x, y, ...)
Arguments
| x | An object of class MizerSim |
|---|---|
| y | Not used |
| ... | For additional arguments see the documentation for
|
Value
A viewport object
A viewport object
See also
Other plotting functions:
animateSpectra(),
displayFrames(),
plotBiomass(),
plotDiet(),
plotFMort(),
plotFeedingLevel(),
plotGrowthCurves(),
plotPredMort(),
plotSpectra(),
plotYieldGear(),
plotYield(),
plotlyBiomass(),
plotlyFMort(),
plotlyFeedingLevel(),
plotlyGrowthCurves(),
plotlyPredMort(),
plotlySpectra(),
plotlyYieldGear(),
plotlyYield(),
plotting_functions
Examples
data(NS_species_params_gears) data(inter) params <- suppressMessages(newMultispeciesParams(NS_species_params_gears, inter)) sim <- project(params, effort=1, t_max=20, t_save = 2, progress_bar = FALSE) plot(sim)data(NS_species_params_gears) data(inter) params <- suppressMessages(newMultispeciesParams(NS_species_params_gears, inter)) plot(params)