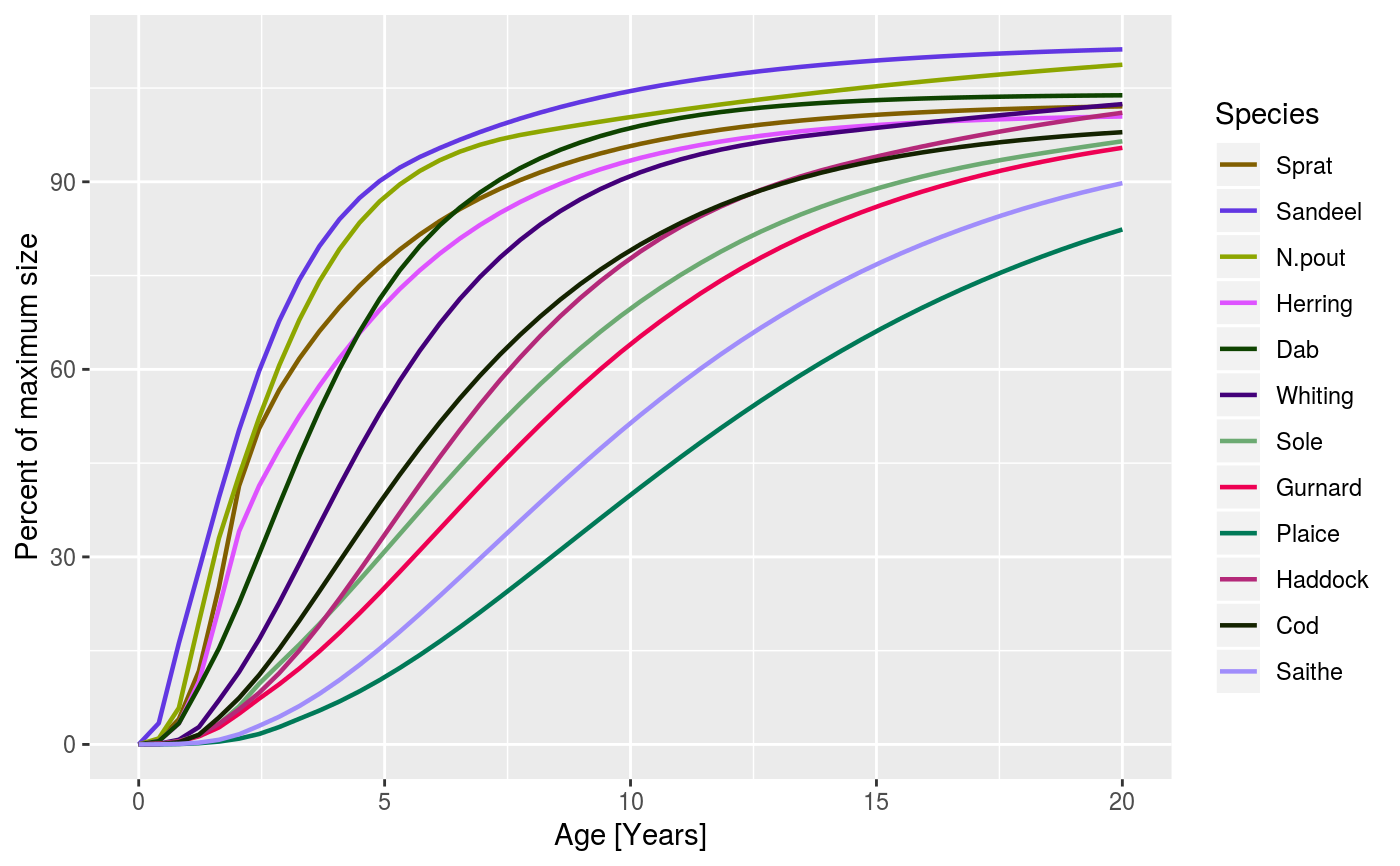
Plot growth curves giving weight as a function of age
Edit this page. Source:R/plots.R
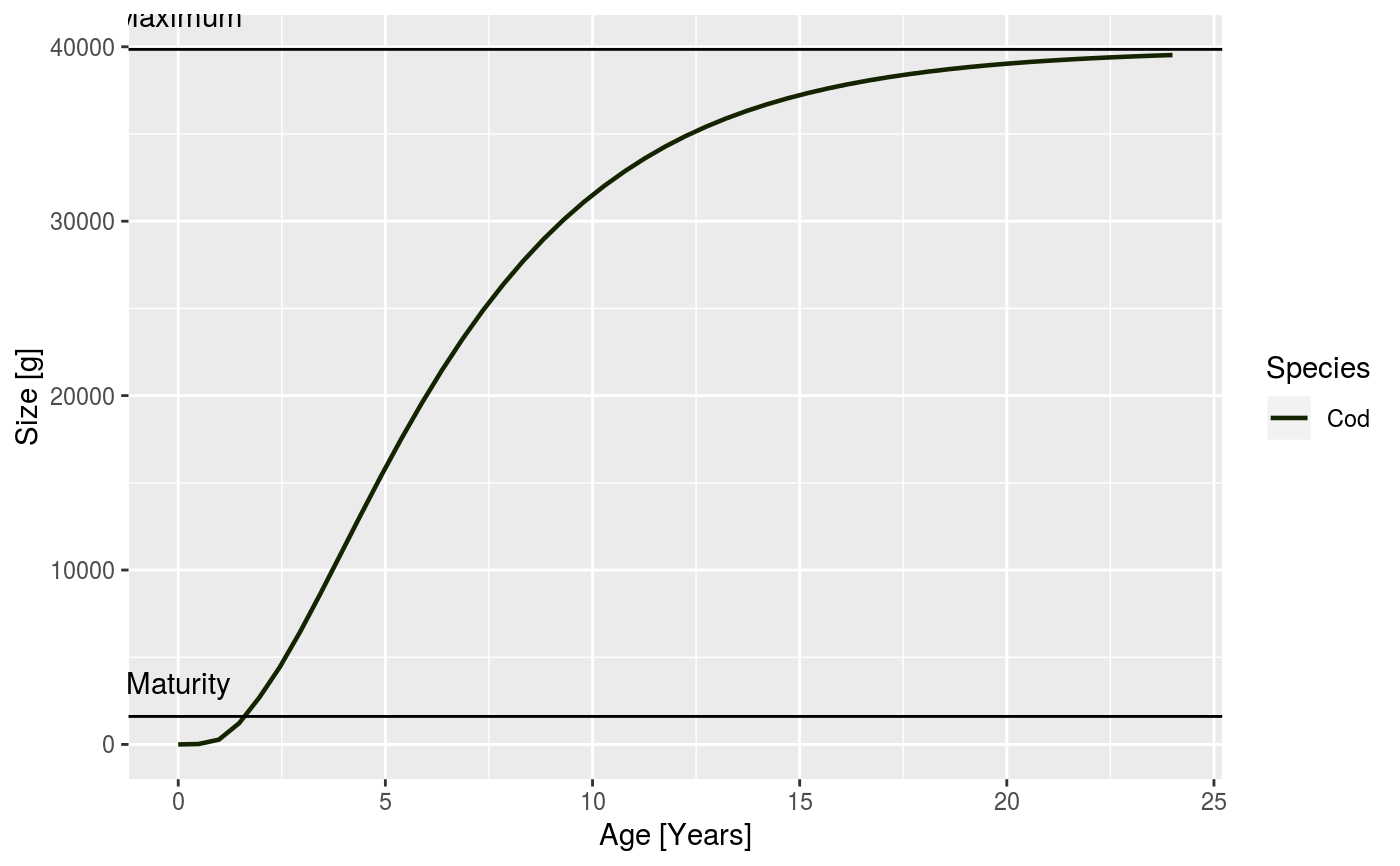
plotGrowthCurves.RdWhen the growth curve for only a single species is plotted, horizontal lines are included that indicate the maturity size and the maximum size for that species. If furthermore the species parameters contain the variables a and b for length to weight conversion and the von Bertalanffy parameter k_vb (and optionally t0), then the von Bertalanffy growth curve is superimposed in black.
plotGrowthCurves(
  object,
  species,
  max_age = 20,
  percentage = FALSE,
  highlight = NULL
)
Arguments
| object | MizerSim or MizerParams object. If given a MizerSim object, uses the growth rates at the final time of a simulation to calculate the size at age. If given a MizerParams object, uses the initial growth rates instead. |
|---|---|
| species | Name or vector of names of the species to be included. By default all species are included. |
| max_age | The age up to which to run the growth curve. Default is 20. |
| percentage | Boolean value. If TRUE, the size is given as a percentage of the maximal size. |
| highlight | Name or vector of names of the species to be highlighted. |
Value
A ggplot2 object
See also
Other plotting functions:
animateSpectra(),
displayFrames(),
plot,MizerSim,missing-method,
plotBiomass(),
plotDiet(),
plotFMort(),
plotFeedingLevel(),
plotPredMort(),
plotSpectra(),
plotYieldGear(),
plotYield(),
plotlyBiomass(),
plotlyFMort(),
plotlyFeedingLevel(),
plotlyGrowthCurves(),
plotlyPredMort(),
plotlySpectra(),
plotlyYieldGear(),
plotlyYield(),
plotting_functions
Examples
data(NS_species_params_gears)
data(inter)
params <- suppressMessages(newMultispeciesParams(NS_species_params_gears, inter))
sim <- project(params, effort=1, t_max=20, t_save = 2, progress_bar = FALSE)
plotGrowthCurves(sim, percentage = TRUE)plotGrowthCurves(sim, species = "Cod", max_age = 24)