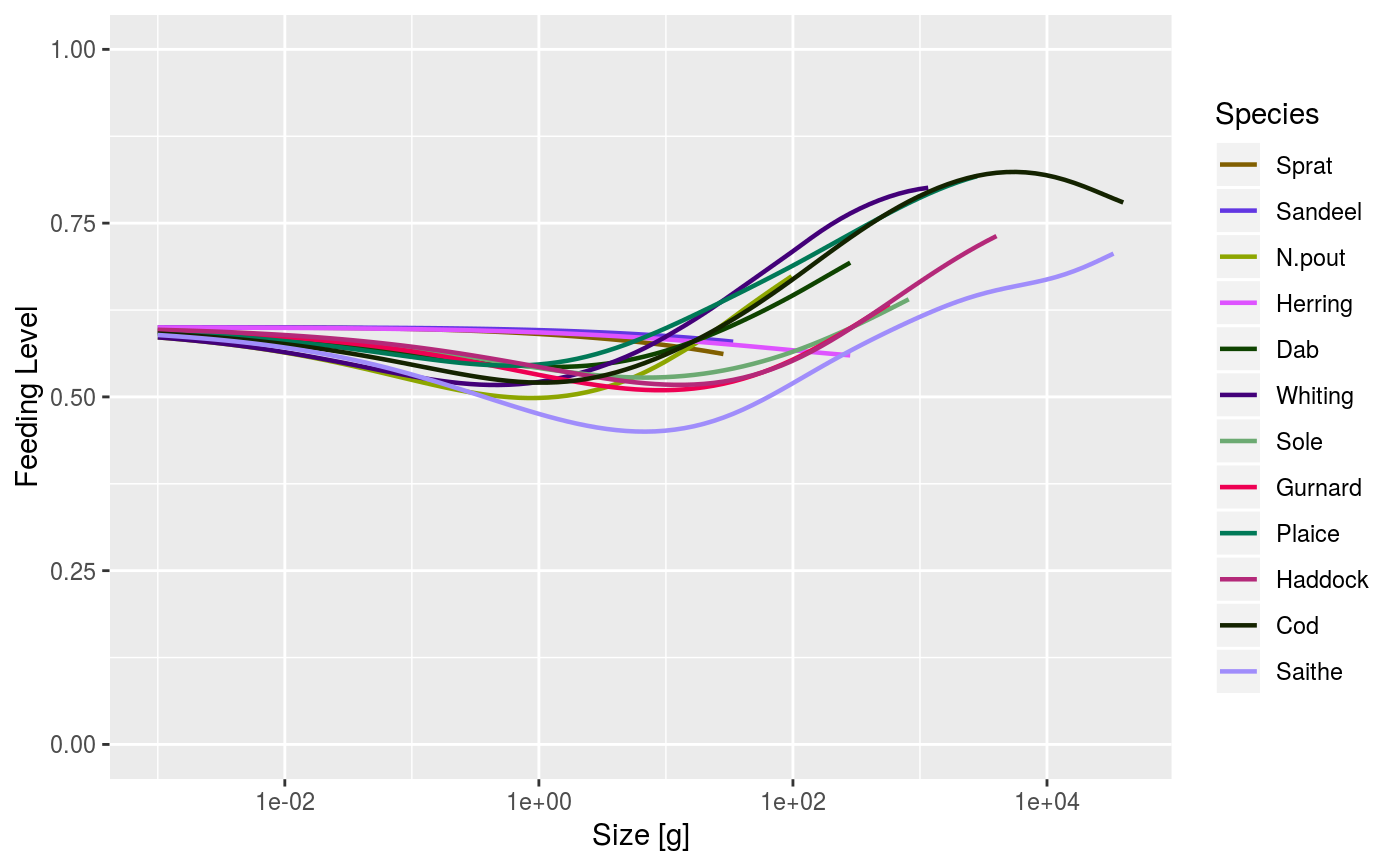
After running a projection, plot the feeding level of each species by size. The feeding level is averaged over the specified time range (a single value for the time range can be used).
plotFeedingLevel(
  object,
  species = NULL,
  time_range,
  highlight = NULL,
  all.sizes = FALSE,
  ...
)
Arguments
| object | An object of class MizerSim or MizerParams. |
|---|---|
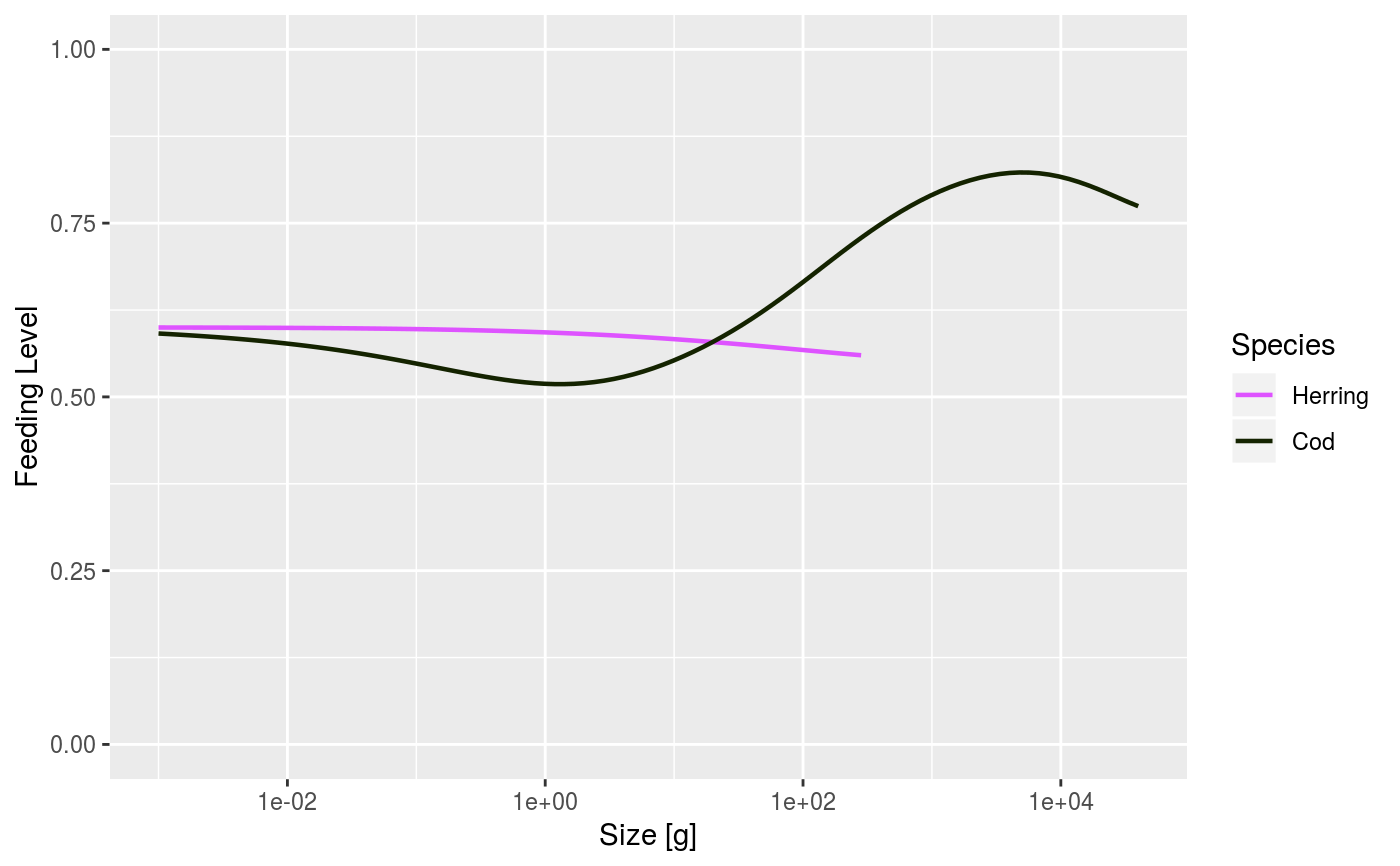
| species | Name or vector of names of the species to be plotted. By default all species are plotted. |
| time_range | The time range (either a vector of values, a vector of min and max time, or a single value) to average the abundances over. Default is the final time step. Ignored when called with a MizerParams object. |
| highlight | Name or vector of names of the species to be highlighted. |
| all.sizes | If TRUE, then feeding level is plotted also for sizes outside a species' size range. Default FALSE. |
| ... | Other arguments (currently unused) |
Value
A ggplot2 object
Details
When called with a MizerSim object, the feeding level is averaged over the specified time range (a single value for the time range can be used to plot a single time step). When called with a MizerParams object the initial feeding level is plotted.
See also
plotting_functions, getFeedingLevel
Other plotting functions:
animateSpectra(),
displayFrames(),
plot,MizerSim,missing-method,
plotBiomass(),
plotDiet(),
plotFMort(),
plotGrowthCurves(),
plotPredMort(),
plotSpectra(),
plotYieldGear(),
plotYield(),
plotlyBiomass(),
plotlyFMort(),
plotlyFeedingLevel(),
plotlyGrowthCurves(),
plotlyPredMort(),
plotlySpectra(),
plotlyYieldGear(),
plotlyYield(),
plotting_functions
Examples
data(NS_species_params_gears) data(inter) params <- suppressMessages(newMultispeciesParams(NS_species_params_gears, inter)) sim <- project(params, effort=1, t_max=20, t_save = 2, progress_bar = FALSE) plotFeedingLevel(sim)