Plot the total yield of each species by gear through time
Edit this page. Source:R/plots.R
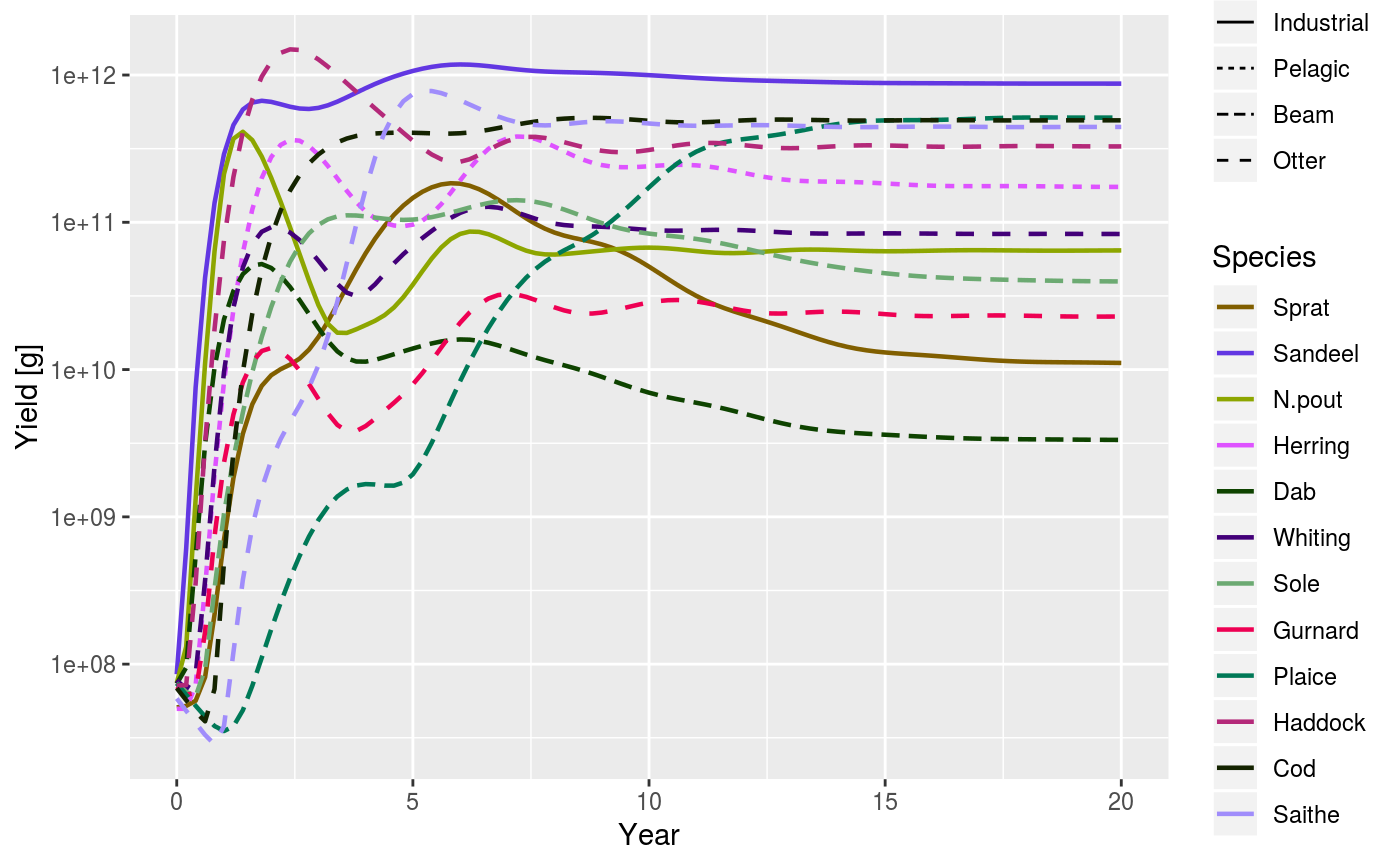
plotYieldGear.RdAfter running a projection, the total yield of each species by fishing gear can be plotted against time.
plotYieldGear(
  sim,
  species = dimnames(sim@n)$sp,
  total = FALSE,
  highlight = NULL,
  ...
)
Arguments
| sim | An object of class MizerSim |
|---|---|
| species | Name or vector of names of the species to be plotted. By default all species are plotted. |
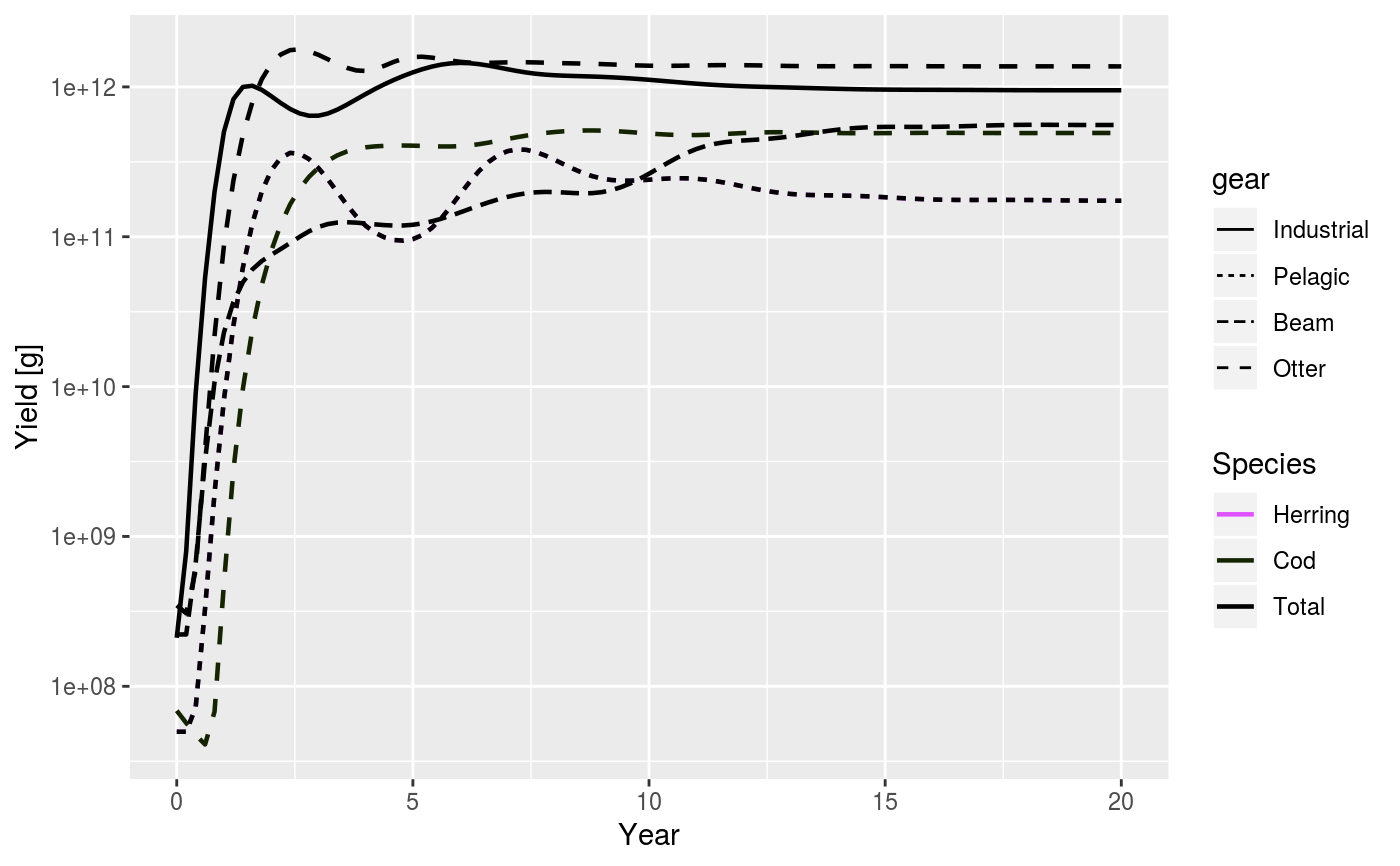
| total | A boolean value that determines whether the total over all species in the system is plotted as well. Default is FALSE |
| highlight | Name or vector of names of the species to be highlighted. |
| ... | Other arguments (currently unused) |
Value
A ggplot2 object
Details
This plot is pretty easy to do by hand. It just
gets the biomass using the getYieldGear method and plots using
the ggplot2 package. You can then fiddle about with colours and linetypes
etc. Just look at the source code for details.
See also
plotting_functions, getYieldGear
Other plotting functions:
animateSpectra(),
displayFrames(),
plot,MizerSim,missing-method,
plotBiomass(),
plotDiet(),
plotFMort(),
plotFeedingLevel(),
plotGrowthCurves(),
plotPredMort(),
plotSpectra(),
plotYield(),
plotlyBiomass(),
plotlyFMort(),
plotlyFeedingLevel(),
plotlyGrowthCurves(),
plotlyPredMort(),
plotlySpectra(),
plotlyYieldGear(),
plotlyYield(),
plotting_functions
Examples
data(NS_species_params_gears) data(inter) params <- suppressMessages(newMultispeciesParams(NS_species_params_gears, inter)) sim <- project(params, effort=1, t_max=20, t_save = 0.2, progress_bar = FALSE) plotYieldGear(sim)