Get data frame of biomass of species through time, ready for ggplot2
Edit this page. Source:R/plots.R
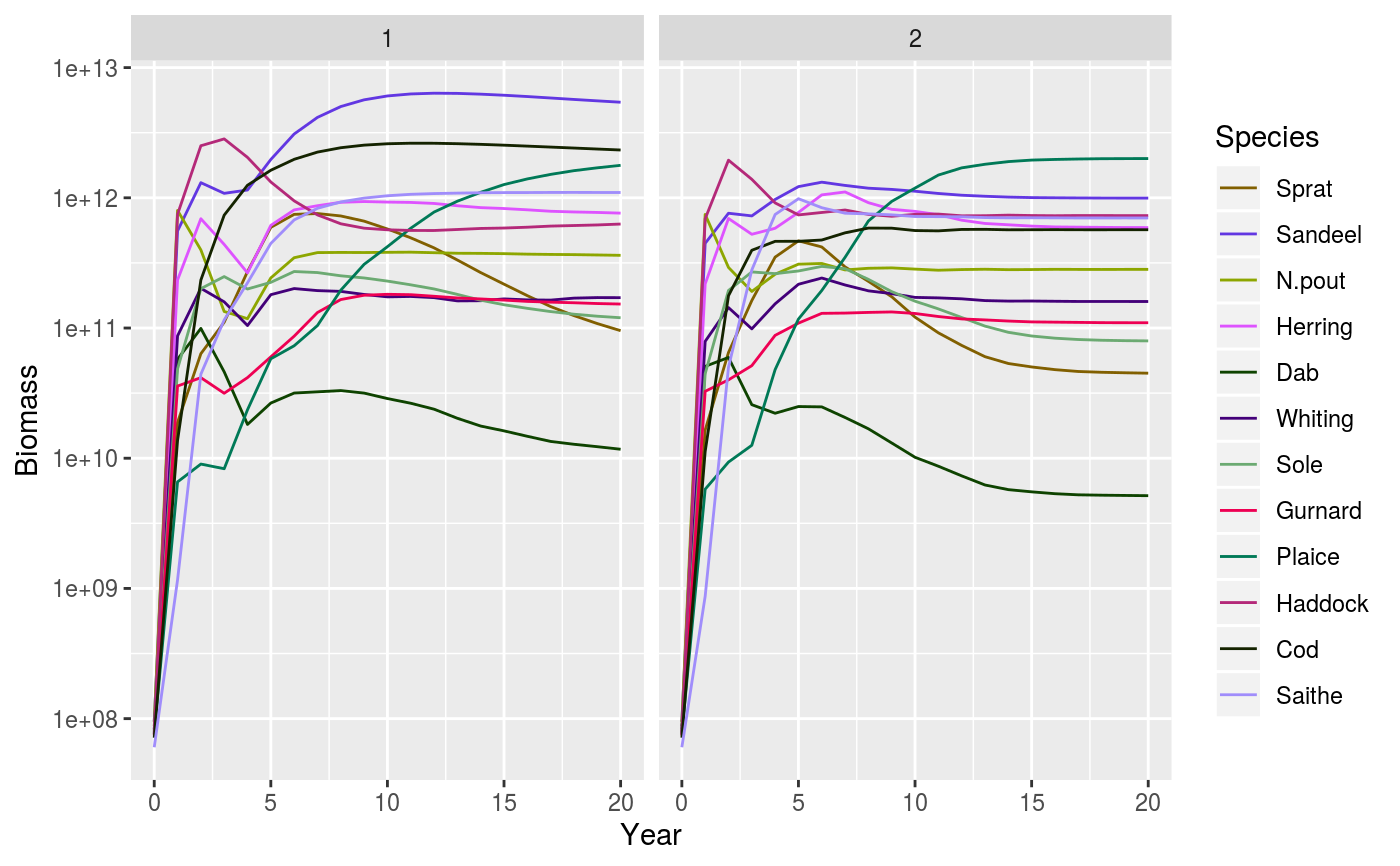
getBiomassFrame.RdAfter running a projection, the biomass of each species can be plotted
against time. The biomass is calculated within user defined size limits
(min_w, max_w, min_l, max_l, see getBiomass). This function
returns a dataframe that can be displayed with
displayFrames.
getBiomassFrame(
  sim,
  species = dimnames(sim@n)$sp[!is.na(sim@params@A)],
  start_time = as.numeric(dimnames(sim@n)[[1]][1]),
  end_time = as.numeric(dimnames(sim@n)[[1]][dim(sim@n)[1]]),
  ylim = c(NA, NA),
  total = FALSE,
  ...
)
Arguments
| sim | An object of class MizerSim |
|---|---|
| species | Name or vector of names of the species to be plotted. By default all species are plotted. |
| start_time | The first time to be plotted. Default is the beginning of the time series. |
| end_time | The last time to be plotted. Default is the end of the time series. |
| ylim | A numeric vector of length two providing lower and upper limits for the y axis. Use NA to refer to the existing minimum or maximum. Any values below 1e-20 are always cut off. |
| total | A boolean value that determines whether the total biomass from all species is plotted as well. Default is FALSE. |
| ... | Arguments passed on to
|
Value
A data frame that can be used in displayFrames
See also
Other frame functions:
displayFrames(),
getSSBFrame()
Examples
# Set up example MizerParams and MizerSim objects
data(NS_species_params_gears)
data(inter)
params <- suppressMessages(newMultispeciesParams(NS_species_params_gears, inter))
sim0 <- project(params, effort=0, t_max=20, progress_bar = FALSE)
sim1 <- project(params, effort=1, t_max=20, progress_bar = FALSE)

# Display biomass from each simulation next to each other
displayFrames(getBiomassFrame(sim0), getBiomassFrame(sim1), params)