Plots the fitted distribution on top of the log ppmr observations, both for the number distribution and the biomass distribution.
Usage
plot_log_ppmr_fit(ppmr_data, fit, type = c("kernel", "histogram"))Examples
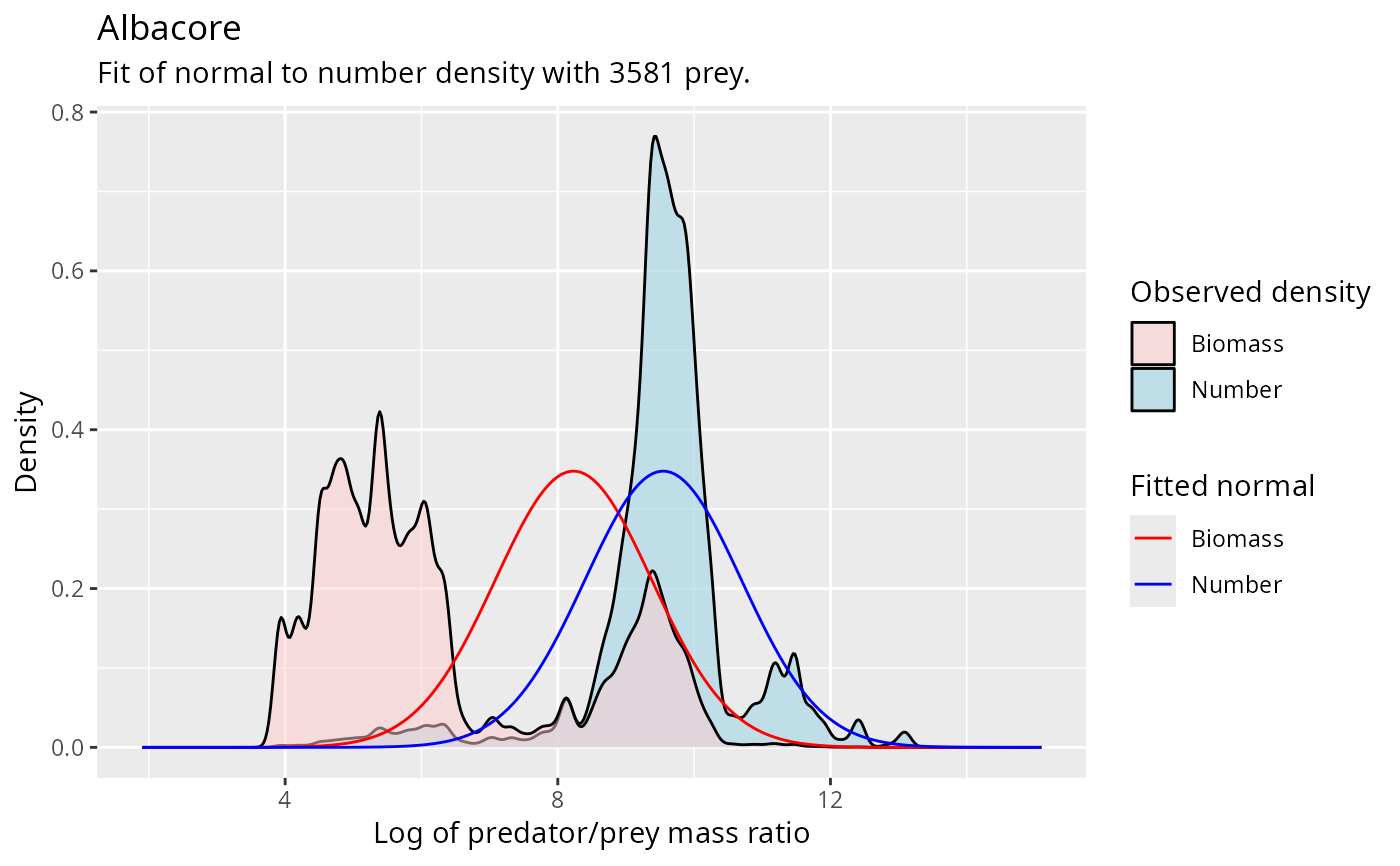
# Plot a normal fit for one species
fit <- fit_log_ppmr(barnes_data, "Albacore", distribution = "normal")
plot_log_ppmr_fit(barnes_data, fit)
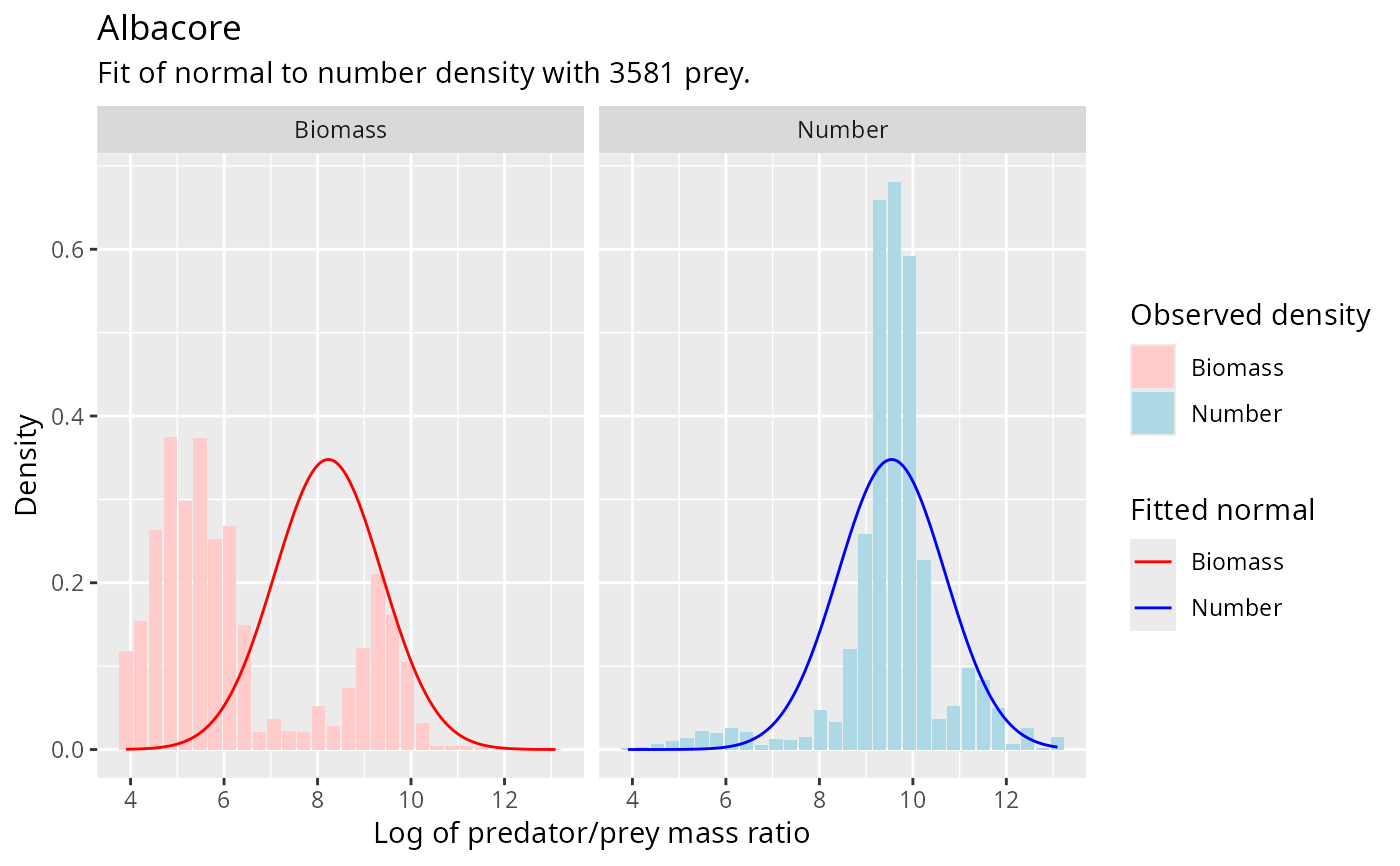
 # Plot with histogram style
plot_log_ppmr_fit(barnes_data, fit, type = "histogram")
# Plot with histogram style
plot_log_ppmr_fit(barnes_data, fit, type = "histogram")
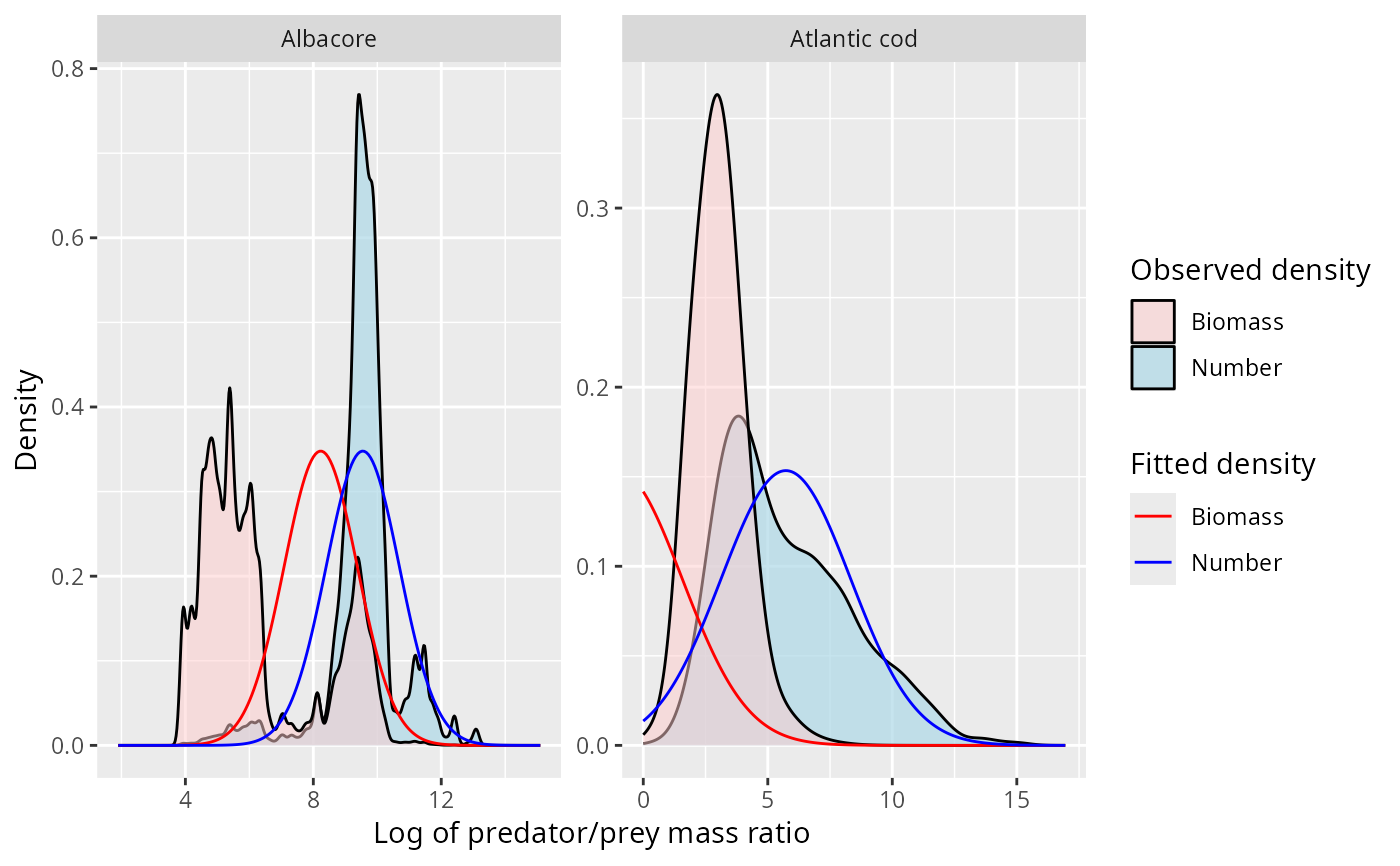
 # Plot fits for multiple species
fit2 <- fit_log_ppmr(barnes_data,
c("Albacore", "Atlantic cod"),
distribution = "normal")
plot_log_ppmr_fit(barnes_data, fit2)
# Plot fits for multiple species
fit2 <- fit_log_ppmr(barnes_data,
c("Albacore", "Atlantic cod"),
distribution = "normal")
plot_log_ppmr_fit(barnes_data, fit2)