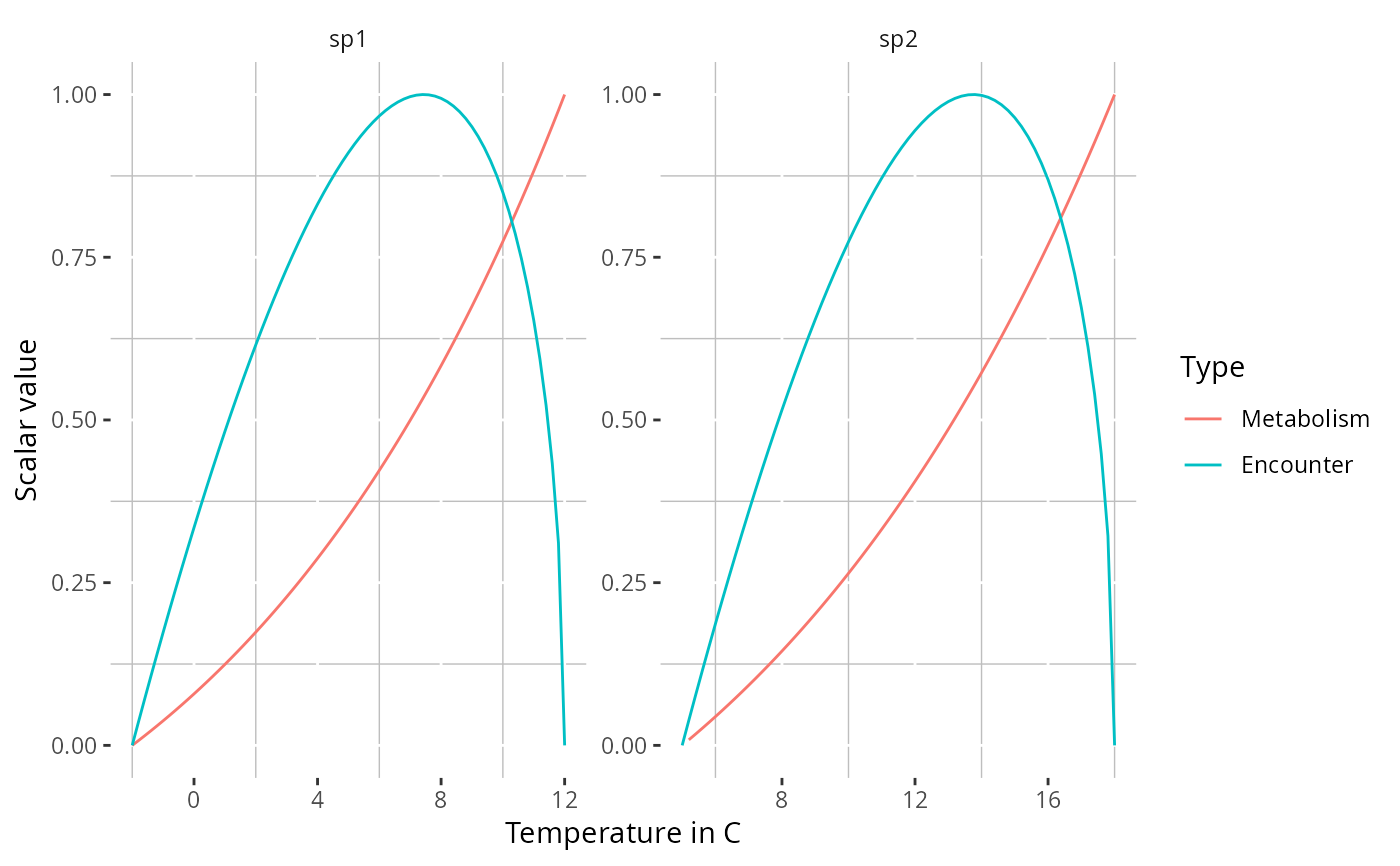
Plot the encounter and metabolic temperature response curves implied by the
species-level thermal parameters stored in params.
Arguments
- params
A therMizer-enabled
MizerParamsobject containing species thermal limits and derived scaling parameters.- resolution
Numeric step size, in degrees C, between temperature values used to evaluate the curves. Default is
0.2.- return_data
Logical. If
TRUE, return the long-format data frame used to build the plot instead of aggplot2object. Default isFALSE.
Value
Either a ggplot2 object or, when return_data = TRUE, a
data frame with columns temperature, Species,
scalar, and Type.
Examples
# \donttest{
params <- suppressMessages(
  mizer::newMultispeciesParams(
    data.frame(species = c("sp1", "sp2"), w_inf = c(100, 1000),
               k_vb = c(0.3, 0.2), w_mat = c(10, 100),
               beta = c(100, 100), sigma = c(2, 2)),
    no_w = 16))
#> Warning: The species parameter data frame is missing a `w_max` column. I am copying over the values from the `w_inf` column. But note that `w_max` should be the maximum size of the largest individual, not the asymptotic size of an average indivdidual.
#> Warning: The species parameter data frame is missing a `w_max` column. I am copying over the values from the `w_inf` column. But note that `w_max` should be the maximum size of the largest individual, not the asymptotic size of an average indivdidual.
params <- suppressWarnings(suppressMessages(
  upgradeTherParams(params,
    temp_min = c(-2, 5), temp_max = c(12, 18),
    ocean_temp_array = c("2000" = 5))))
plotTherPerformance(params)


# Return the underlying data instead of a plot
df <- plotTherPerformance(params, return_data = TRUE)
head(df)
#>   temperature Species     scalar      Type
#> 1        -2.0     sp1 0.00000000 Encounter
#> 2        -1.8     sp1 0.03564302 Encounter
#> 3        -1.6     sp1 0.07081977 Encounter
#> 4        -1.4     sp1 0.10552337 Encounter
#> 5        -1.2     sp1 0.13974672 Encounter
#> 6        -1.0     sp1 0.17348255 Encounter
# }
# Return the underlying data instead of a plot
df <- plotTherPerformance(params, return_data = TRUE)
head(df)
#> temperature Species scalar Type
#> 1 -2.0 sp1 0.00000000 Encounter
#> 2 -1.8 sp1 0.03564302 Encounter
#> 3 -1.6 sp1 0.07081977 Encounter
#> 4 -1.4 sp1 0.10552337 Encounter
#> 5 -1.2 sp1 0.13974672 Encounter
#> 6 -1.0 sp1 0.17348255 Encounter
# }